Project Report
2022 World Cup Data Analysis: Uncovering Modern Football Trends
1. Introduction
1.1 Background and Necessity
The importance of data analysis is increasing every day across many sports. Most teams analyze the opponent's strategy before entering a match. In the field of strategic analysis, teams have moved away from the old method of relying only on intuition and can now take a systematic approach through data. Football also has tactical trends. By analyzing these trends, we can identify the direction of modern football. This study was conducted to help develop future football tactical systems by understanding that direction.
1.2 Research Objective
This study aims to identify the flow of modern football. The data source was set as the 2022 Qatar World Cup. Because the World Cup includes teams from many continents, it is useful for understanding modern football trends without being limited to a specific country or continent. Using indicators obtained from every Qatar World Cup match and each country's tournament result, this study attempts to identify overall characteristics and cluster-specific characteristics. The dataset consists of 37 features, including attacking and defensive indicators.
1.3 Methodology Overview
The data came from the official FIFA website for the 2022 Qatar World Cup. Indicators for each team were organized using all matches from the group stage to the final. After that, the data was preprocessed using Z-score standardization and UMAP dimensionality reduction, and clustering was performed on the resulting data. K-means was used as the clustering algorithm because it is computationally fast and useful for visualization. The algorithm was evaluated with the Elbow Method and Silhouette Score, and the optimal value of K was selected.
2. Research Method
2.1 Data Introduction
This study uses data from the official FIFA website for the 2022 Qatar World Cup. It includes a total of 63 matches from the group stage to the final. Team-level indicators are organized for each match. For each match, 37 features can be obtained per team, and the final dataset was generated by averaging each team's indicators by feature.
2.2 Data Preprocessing
Z-score standardization was applied to the given data, standardizing it
into data with a mean of 1 and a standard deviation of 0. By aligning the
scales among feature values, the stability of the dimensionality reduction
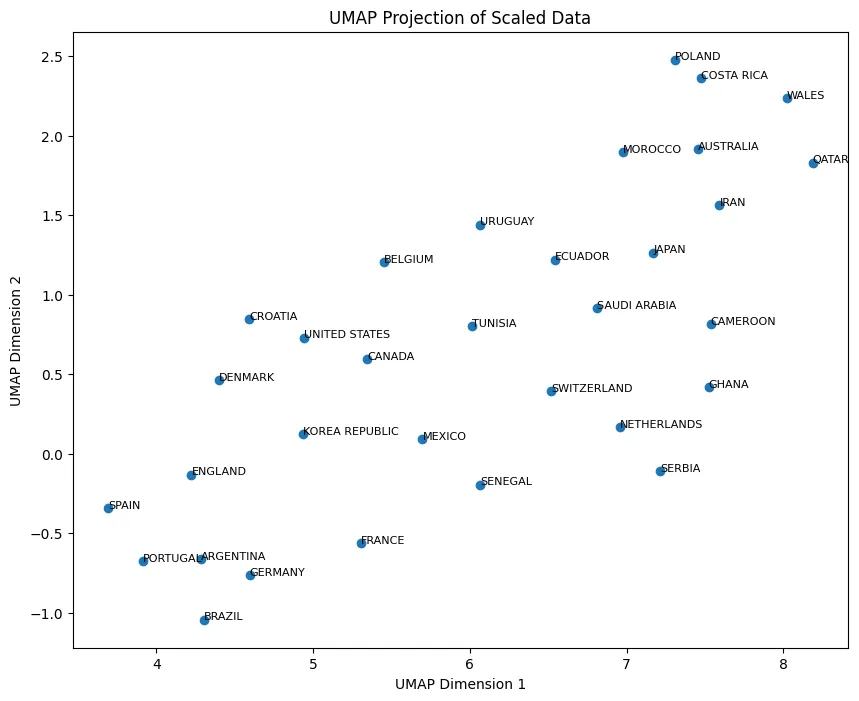
and clustering models used later was secured. Next, UMAP was used for
dimensionality reduction. Because the data is nonlinear, UMAP reduced the
number of features from 37 to 2. The UMAP hyperparameters were set to
n_neighbors=15 and min_dist=0.1 to preserve the
global structure of the data well.
2.3 Checking Correlations Between Features
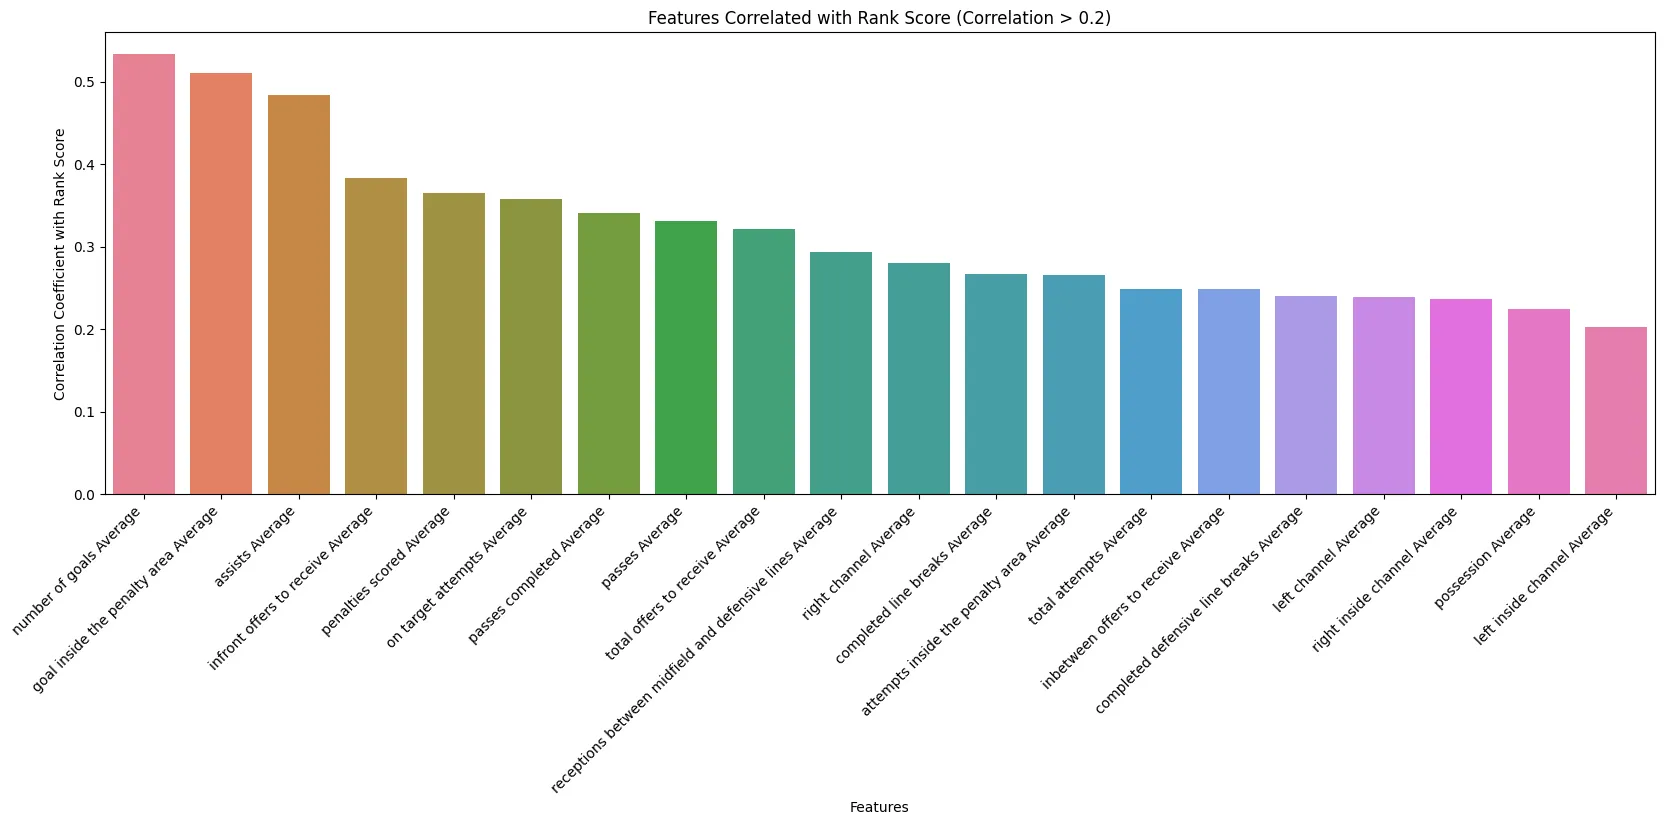
A Rank Score feature was added based on each country's result in the Qatar World Cup, and its correlation with other features was checked. Visualization was performed to identify which characteristics are important for achieving good results in the World Cup.
2.4 Clustering Algorithm
K-means was selected as the clustering algorithm because it supports fast computation and makes it easy to visually inspect clustering results. Although it is vulnerable to noise, this was not a problem because the earlier preprocessing process showed that there was no noise. To speed up the algorithm, k-means++ was selected as the initial value selection method.
2.5 Method for Determining the Number of Clusters
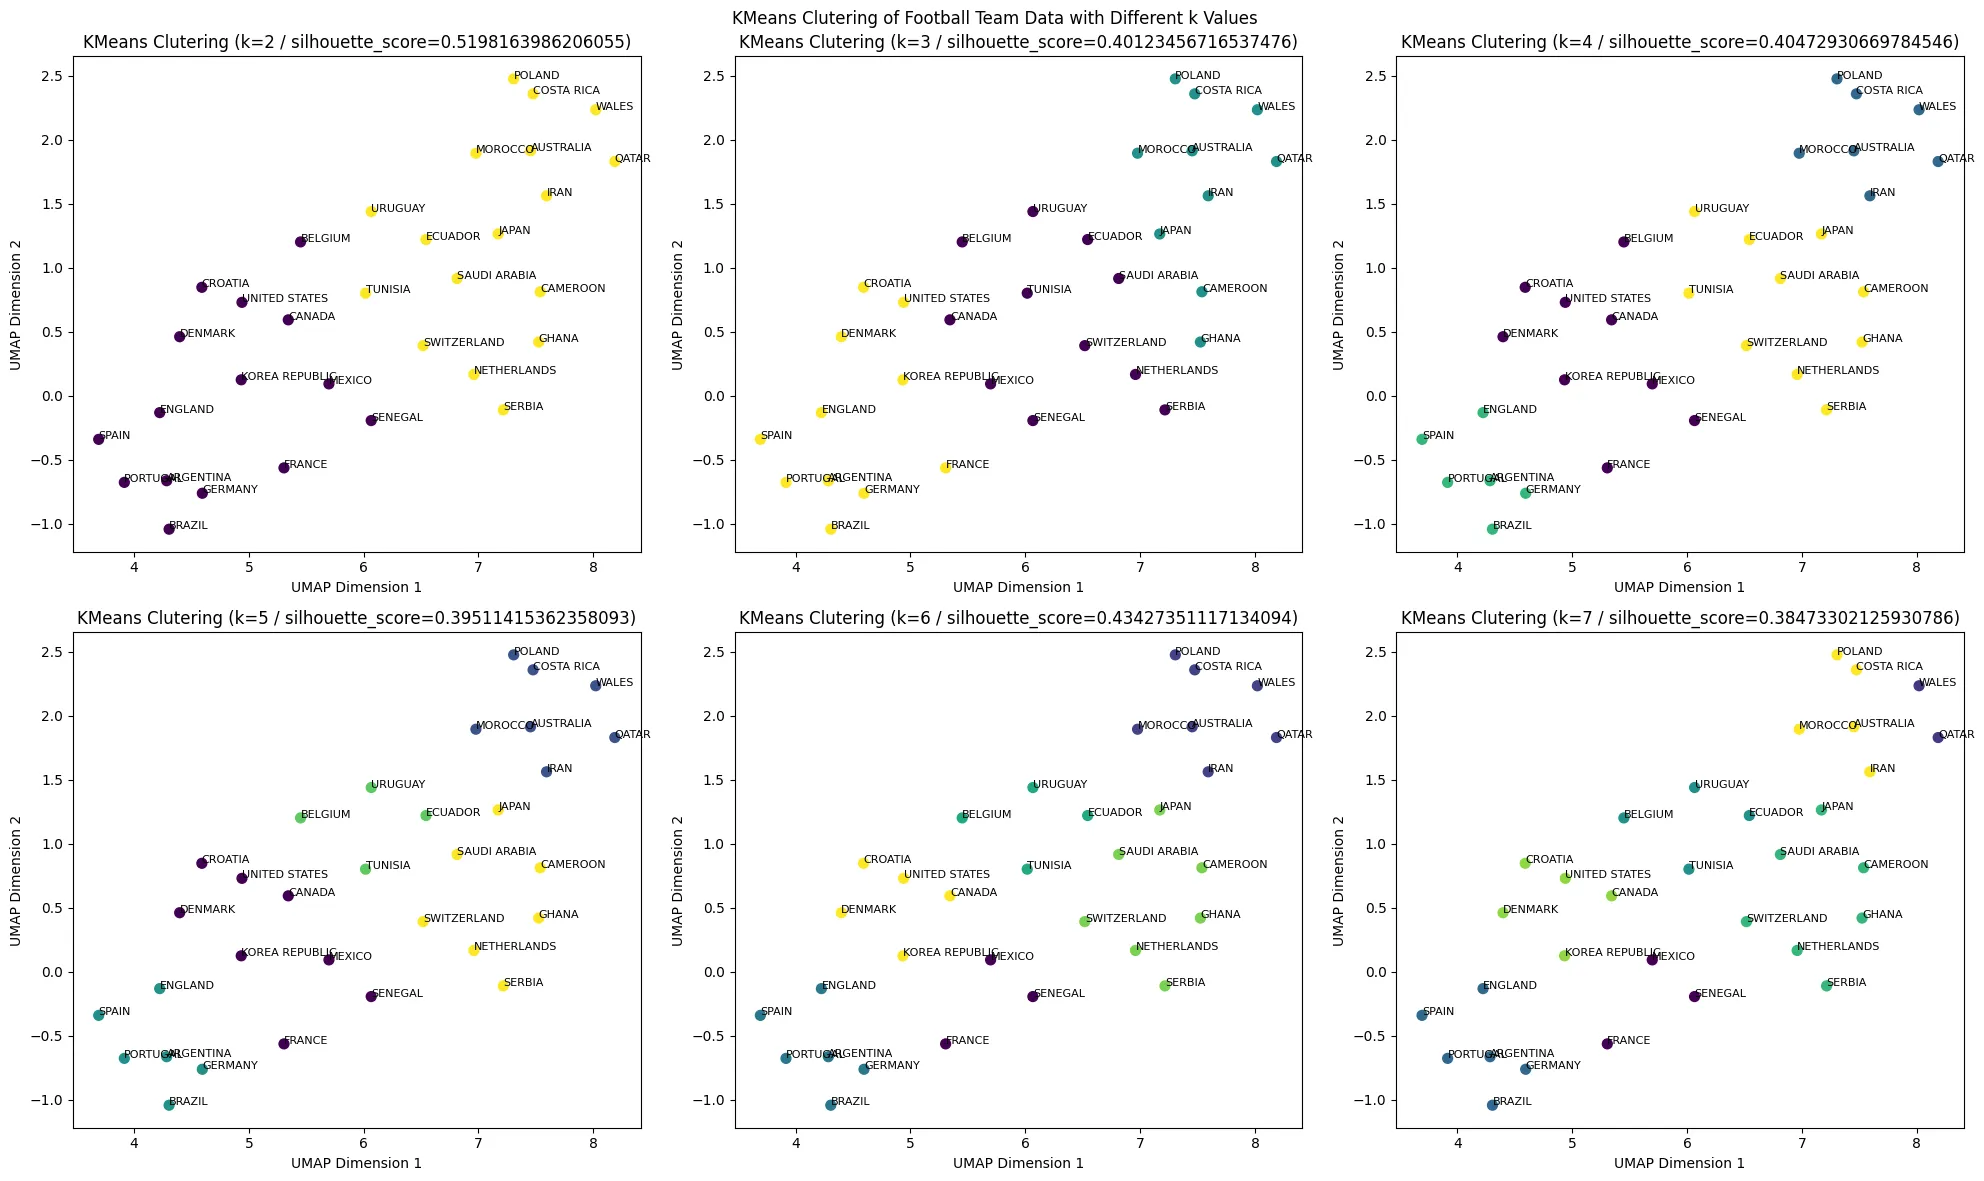
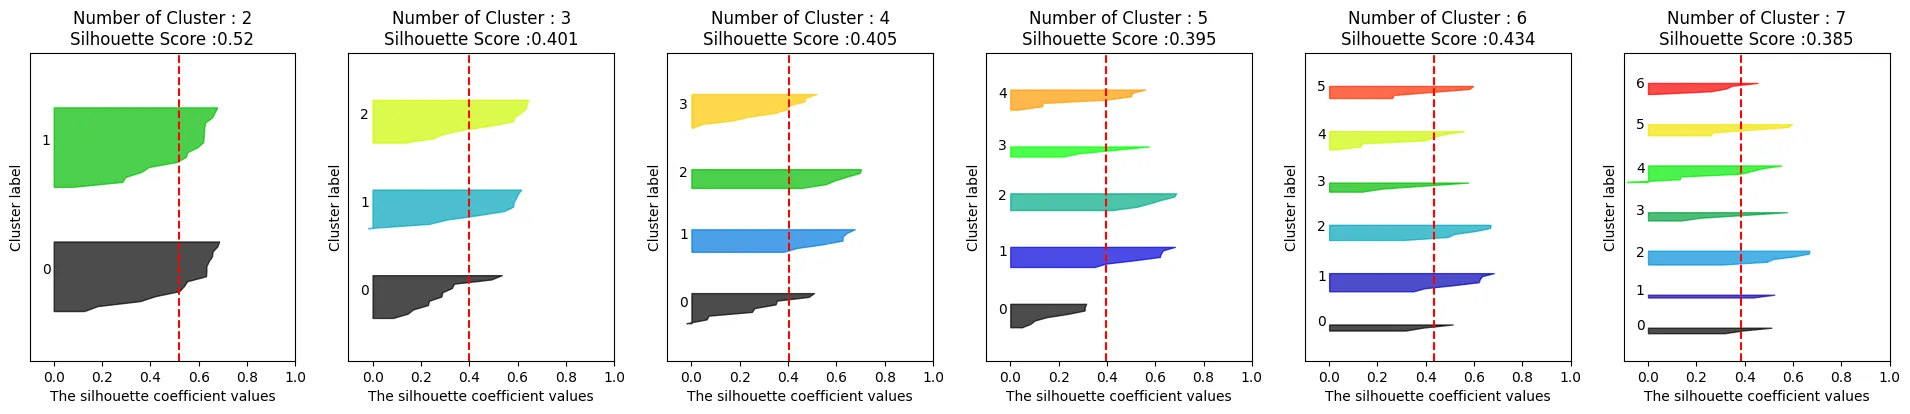
To find the optimal number of clusters, visualization and comparison were performed using the Elbow Method and Silhouette Score. The Elbow Method first suggested that the optimal number of clusters would be 2. Afterward, the average Silhouette Score was calculated for each number of clusters and compared with the Silhouette Score for each cluster. When the number of clusters was 6, the average Silhouette Score was 0.434, and the cluster-level Silhouette Scores were mostly uniform. Therefore, the optimal number of clusters was determined to be 6.
3. Research Results
3.1 Correlation Analysis Results
The correlation between Rank Score and other features was calculated.
infront offers to receive Average recorded 0.382850,
total offers to receive Average recorded 0.321767, and
inbetween offers to receive Average recorded 0.248061.
Therefore, movements and attempts to receive the ball are important, and
especially movements to receive the ball in high positions are necessary.
In addition, receptions between midfield and defensive lines
Average recorded 0.293273, indicating the importance of receiving
the ball between the opponent's midfield and defensive lines.
left channel Average was measured at 0.238437, and
right channel Average at 0.280012, showing that using wide
spaces is more important than using central areas.
3.2 Clustering Results
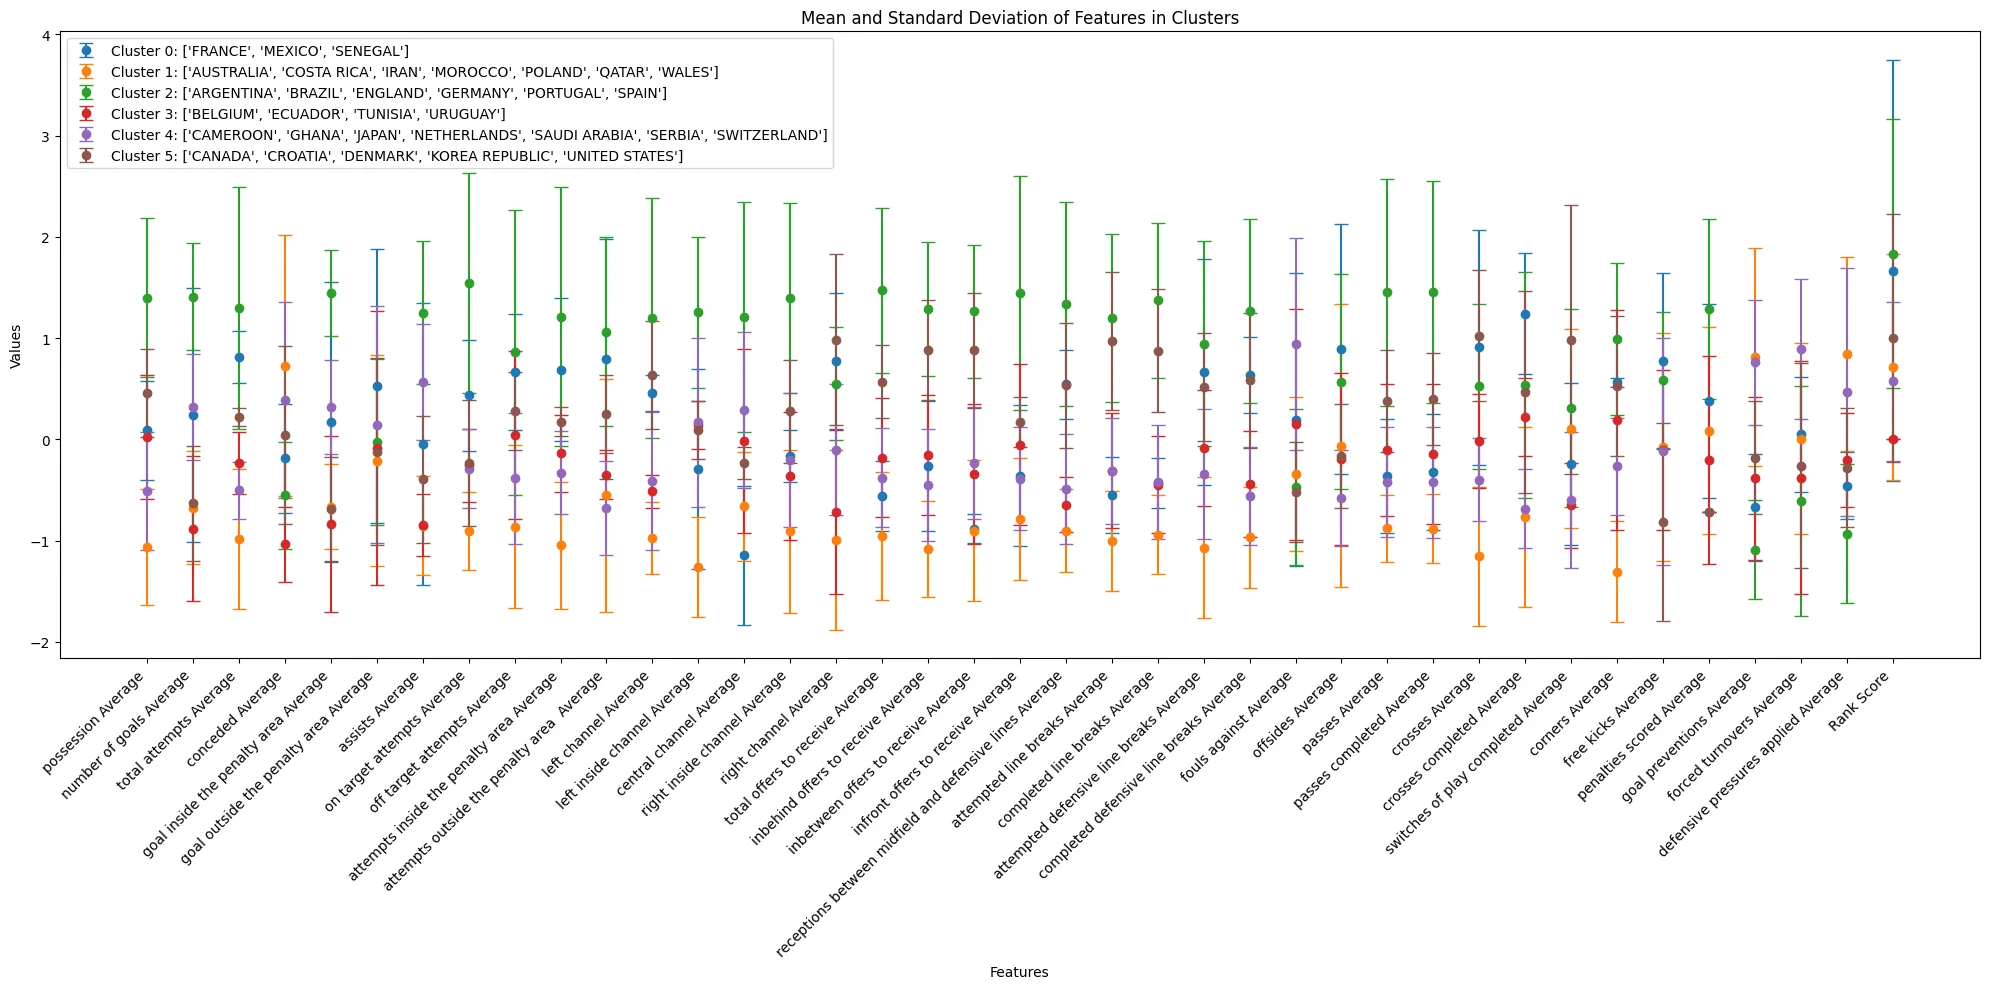
To identify the characteristics of each cluster, the mean and standard deviation of each cluster's features were visualized with error bars. Cluster 2, which includes Argentina, the Qatar World Cup champion, as well as football powerhouses Brazil, England, Germany, Portugal, and Spain, recorded high values in most features. Its average tournament performance was also excellent. Cluster 0, which includes runner-up France, did not show superior values in most features. Cluster 1 recorded the lowest values in most features, but achieved better results than Clusters 3 and 4. Cluster 3 showed a high goals-conceded rate and recorded the lowest results.
3.3 Team Style Analysis by Cluster
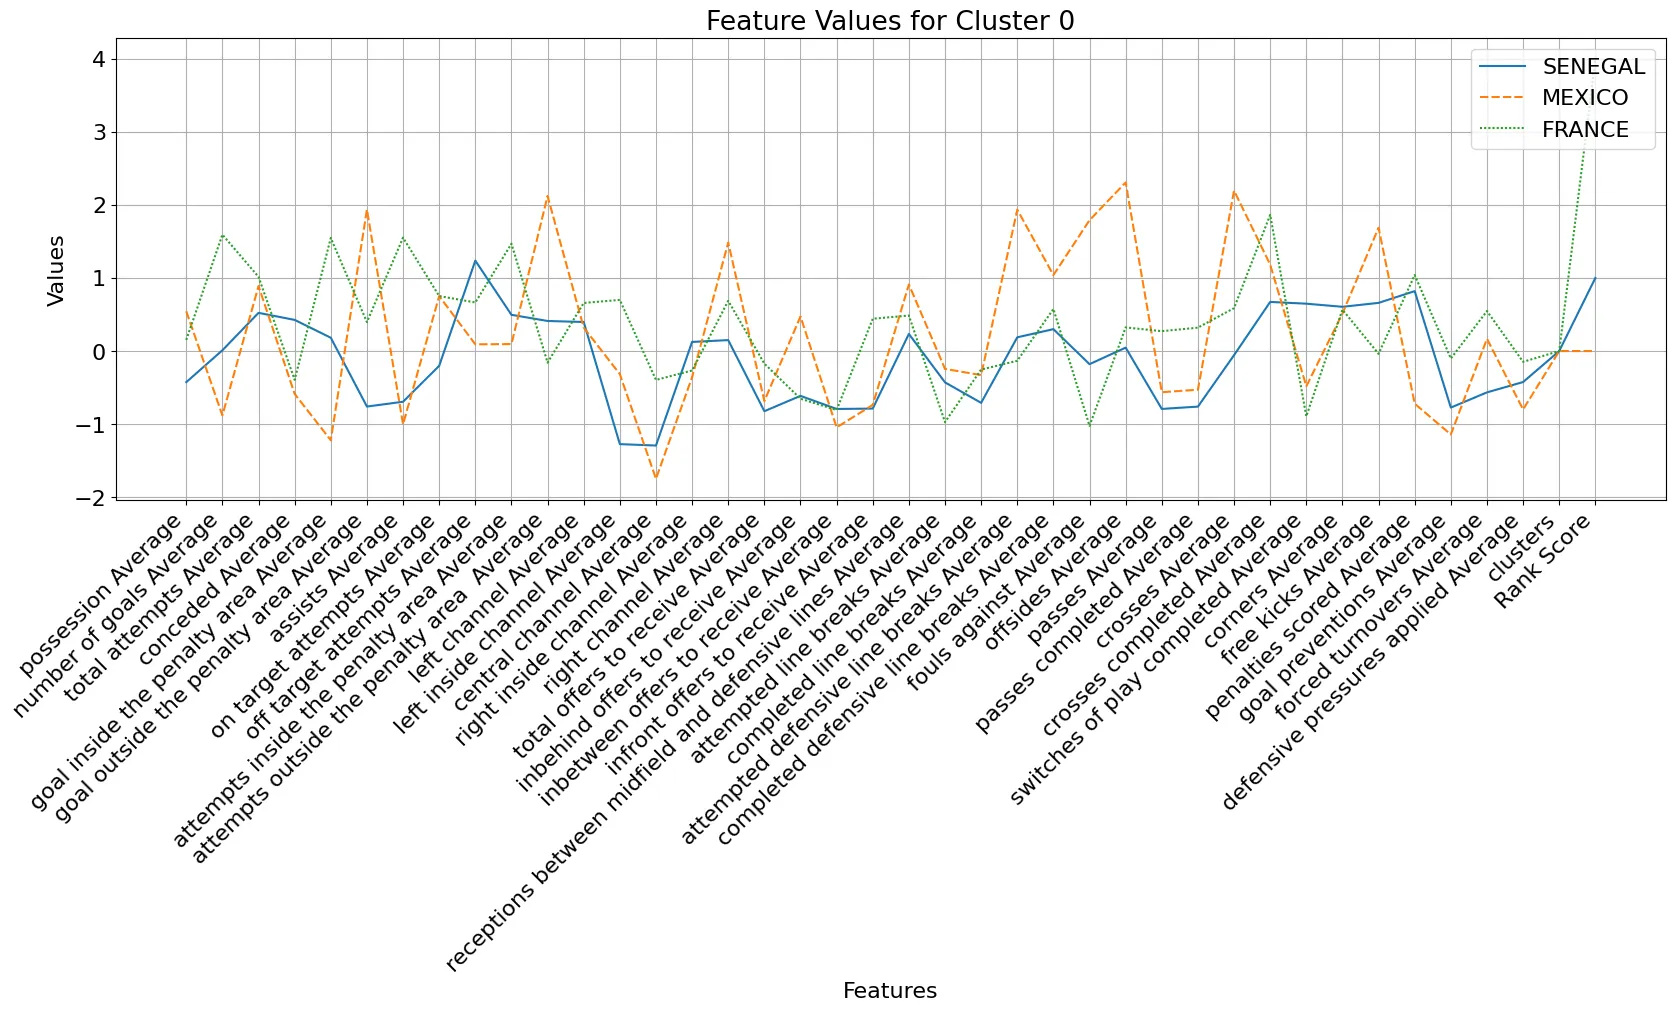
Cluster 0, which includes runner-up France, has high values for
penetration-related indicators such as attempted defensive line
breaks Average, completed defensive line breaks Average,
and offsides Average compared with its pass count and pass
success rate. Also, central channel Average is low, while
right channel Average and left channel Average
are high, showing that it mainly used wide spaces rather than central
spaces. This indicates a direct style of play that attacks the space
behind the defense rather than building the game through short passes.
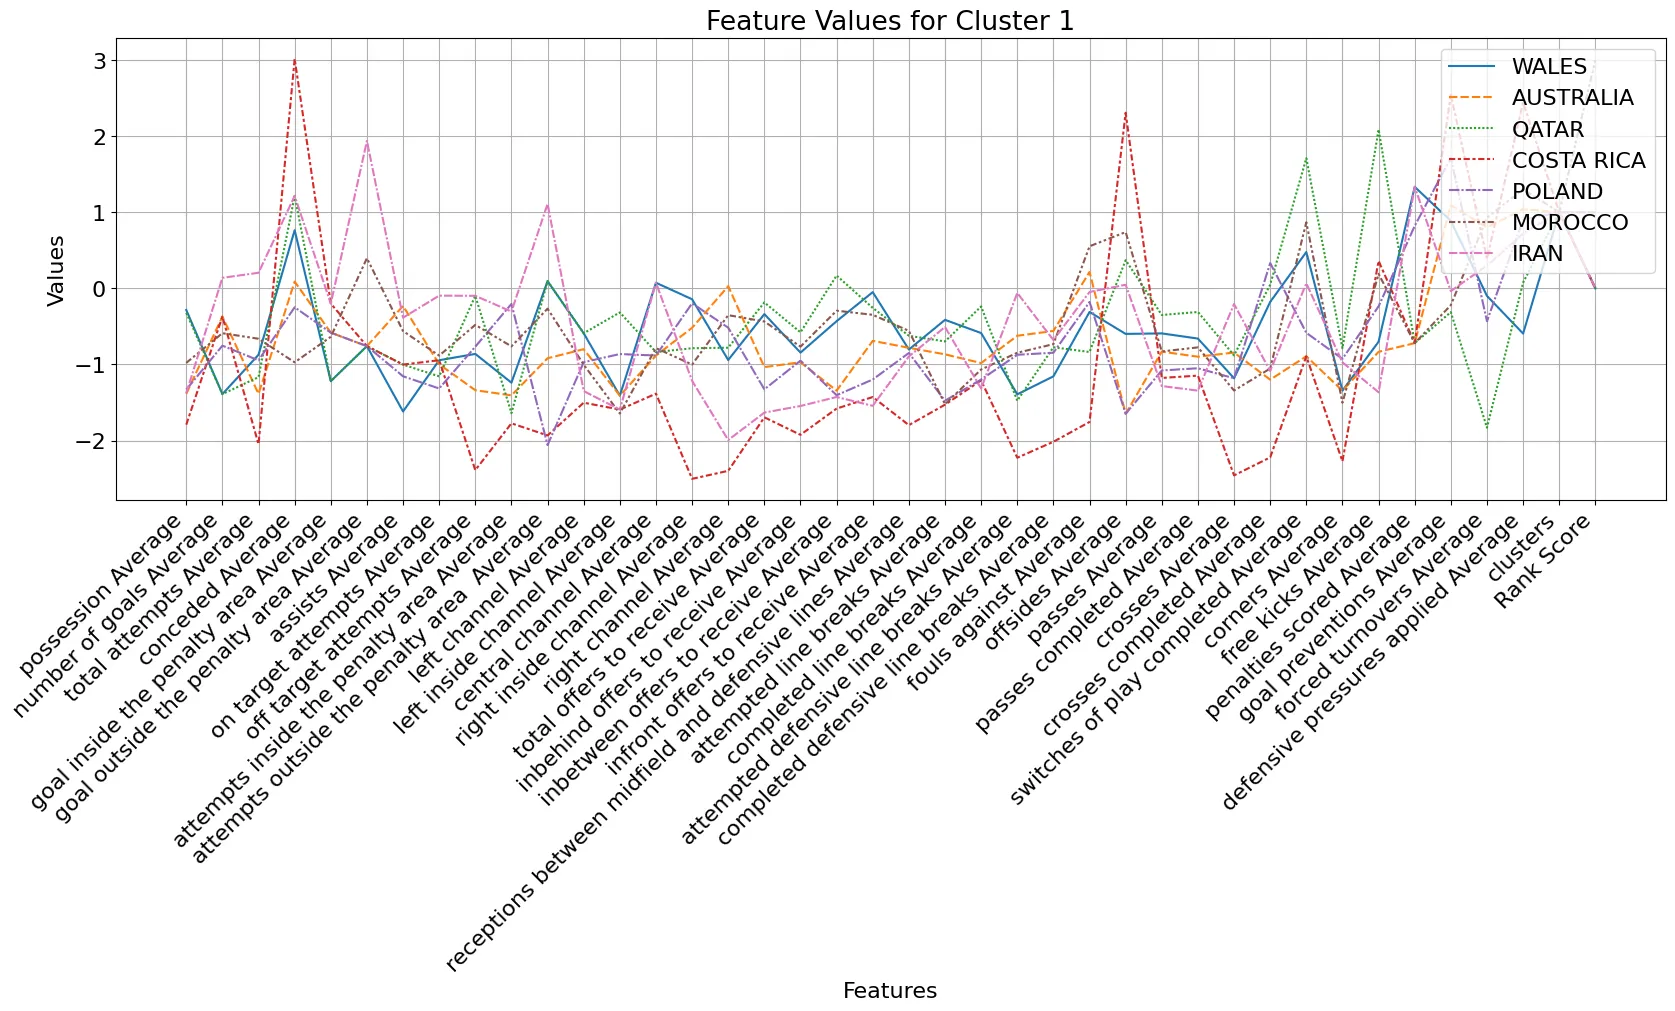
Cluster 1 has low values in most indicators, but achieved better results
than Clusters 3 and 4. Even though most values were low,
goal preventions Average, forced turnovers Average,
and defensive pressures applied Average were recorded at
high levels. Also, switches of play completed Average was
high, meaning that this cluster induced cracks in the opponent's defense.
Overall, it performed well defensively, and this led to good results.
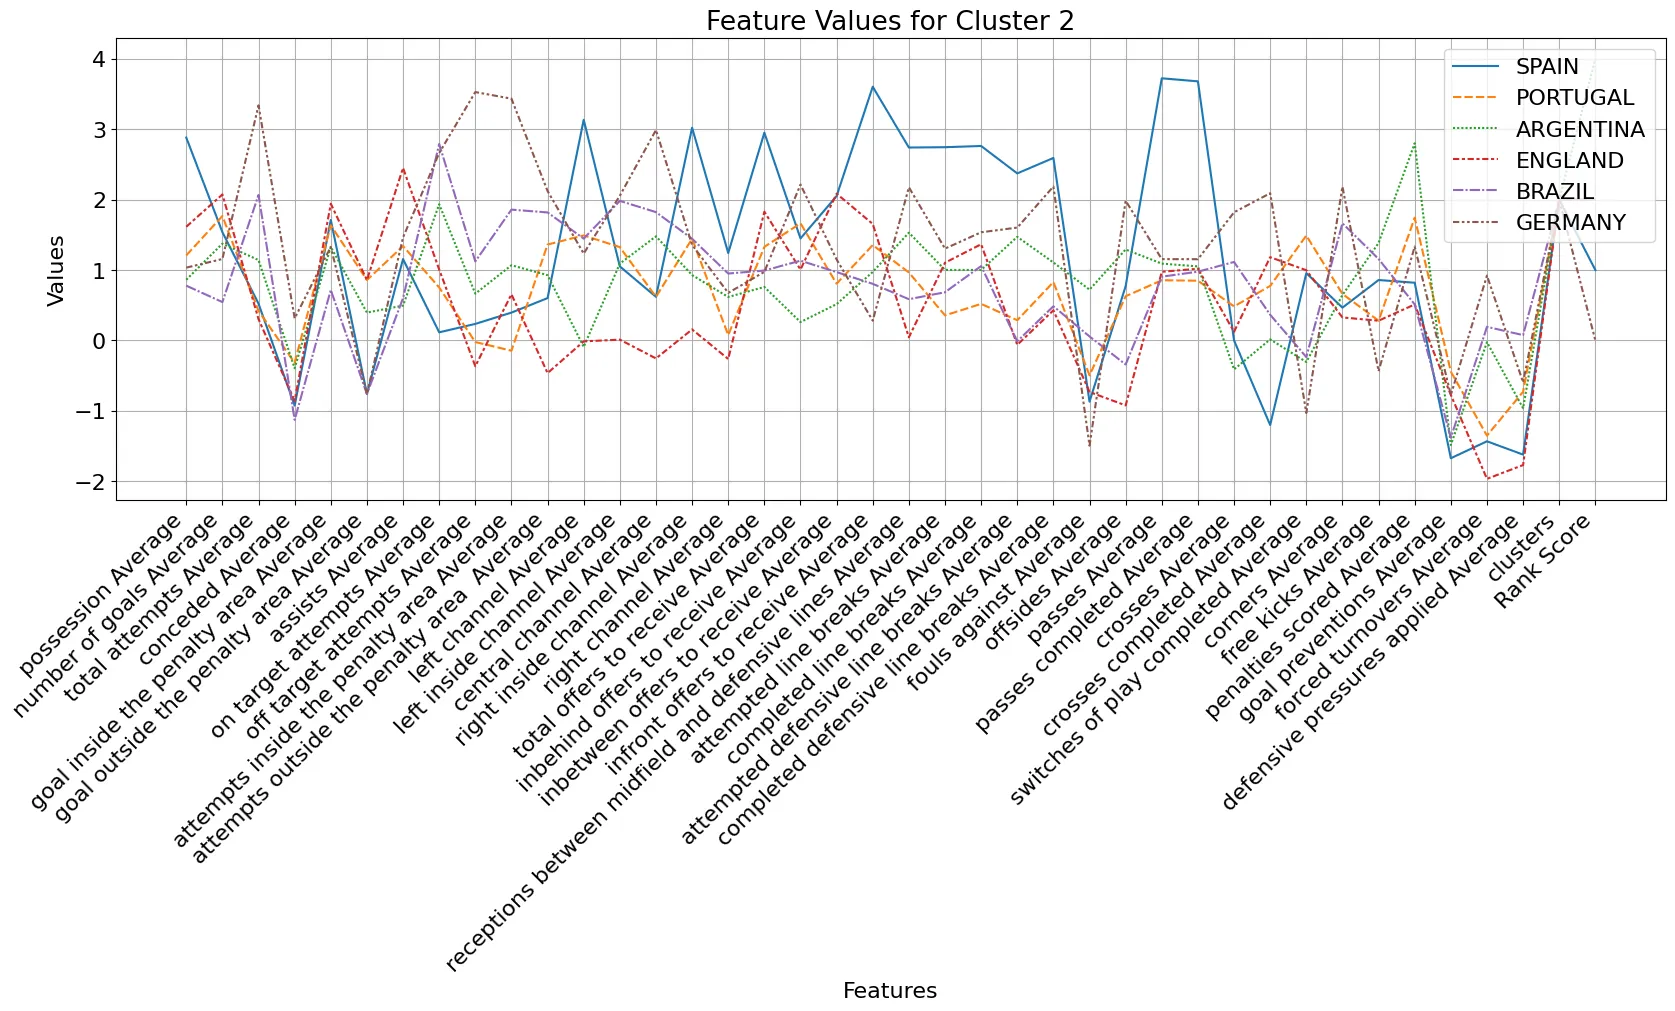
Cluster 2, consisting only of football powerhouses, shows the best values
in most indicators. It recorded overwhelming possession, pass count, and
pass success rate. The high values of left inside channel
Average, central channel Average, and
right inside channel Average suggest strong performance in
central areas. Based on control of central areas, this cluster produced
many shots on target and many goals.
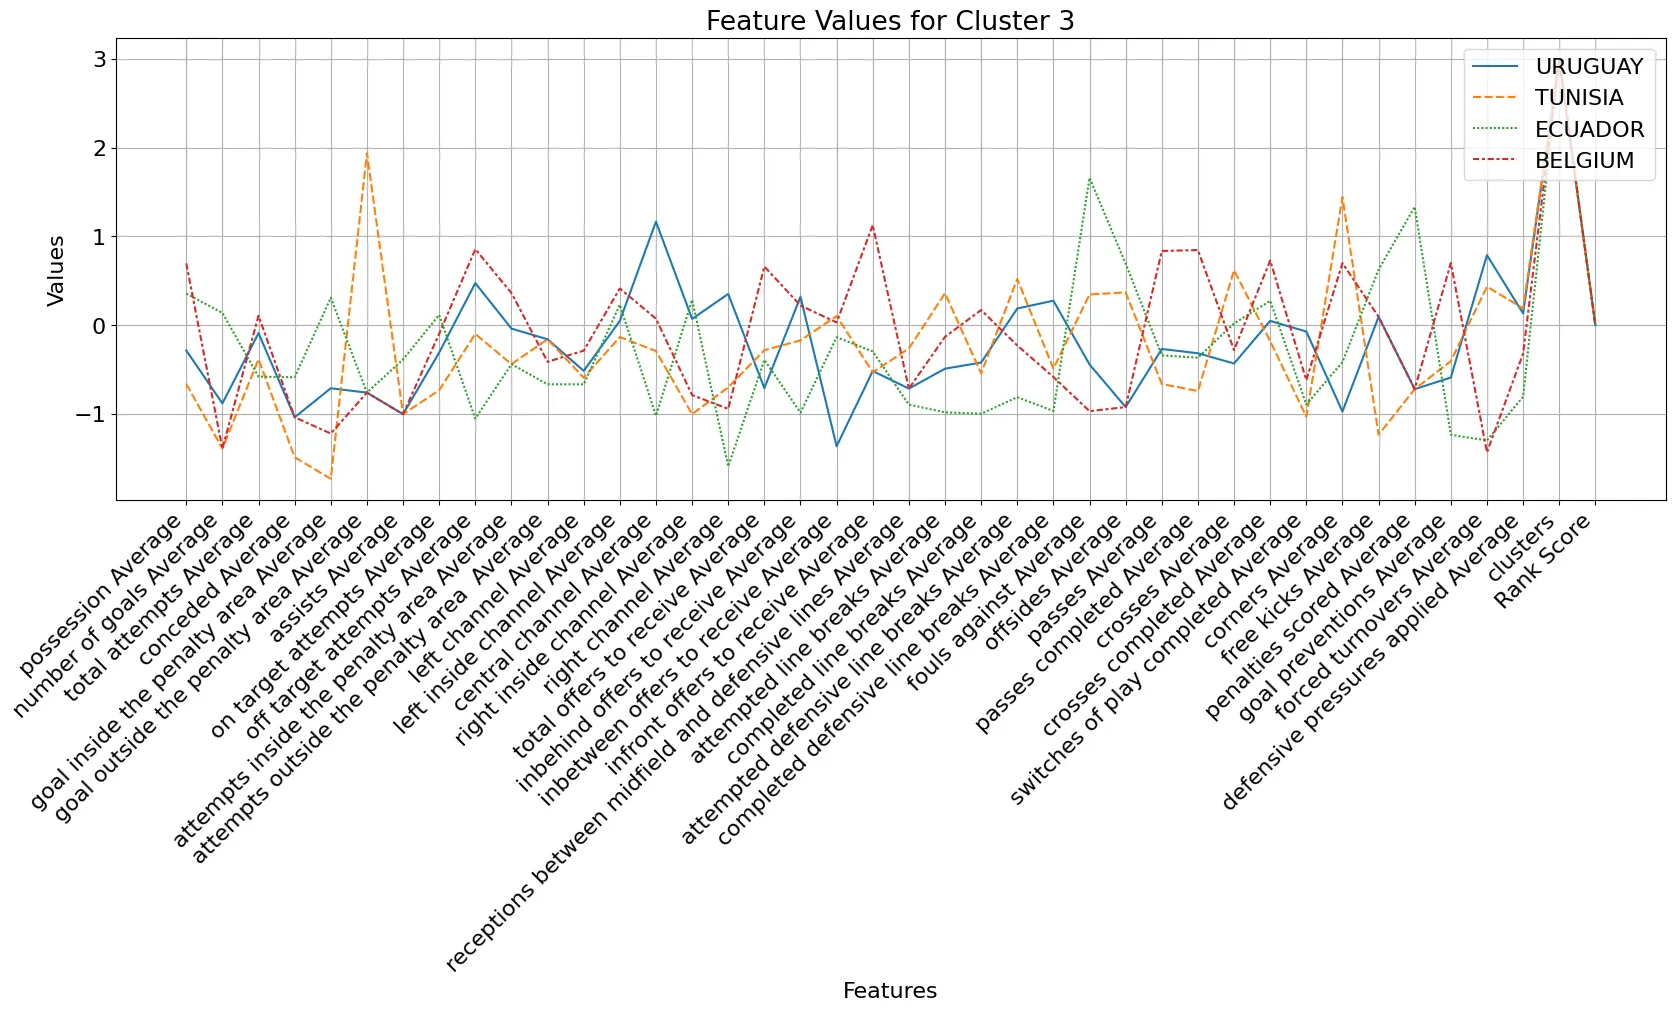
Cluster 3, which recorded the lowest results, did not show outstanding values in either attack or defense compared with other clusters. It had the lowest scoring value and also showed poor defensive indicators. Unstable defense and unclear attacking ability appear to be the main reasons for its low results.
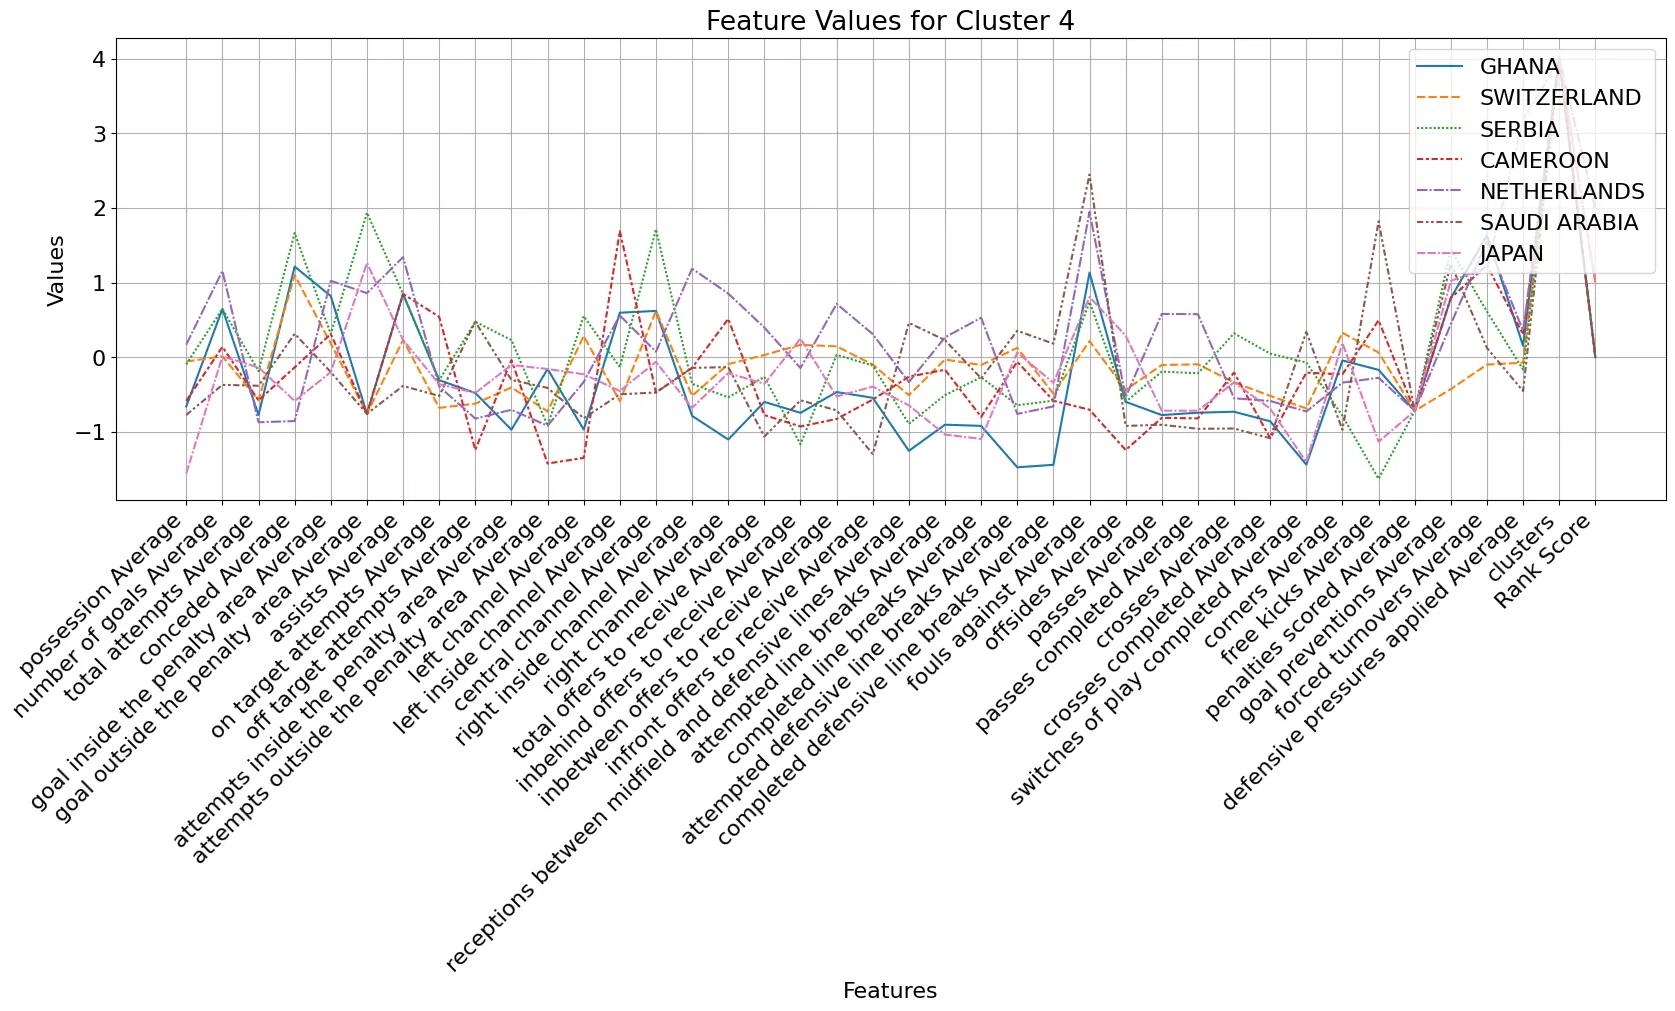
Cluster 4 shows low values in most indicators, such as low possession,
few passes, and low pass success rate. However, its goal inside the
penalty area Average value is high. This shows that even though its
overall performance was not strong, it had the ability to score from few
chances through finishing inside the box. Compared with attacking
indicators, its defensive indicators show good values.
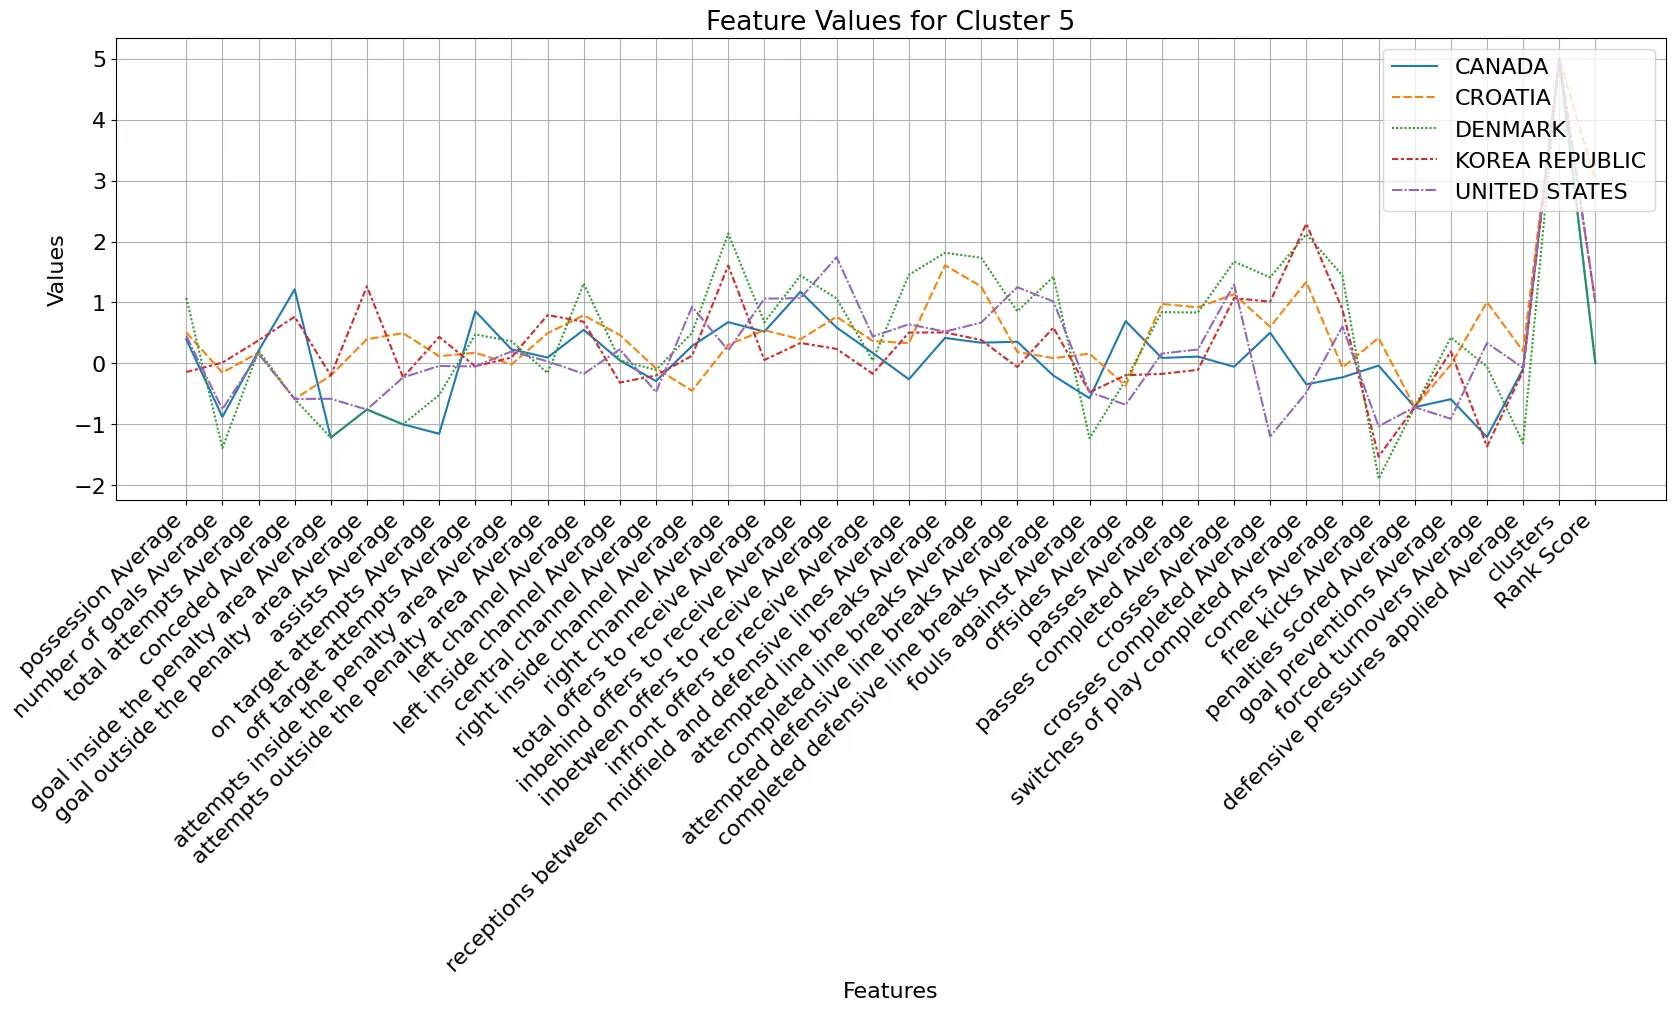
Cluster 5 recorded the best values after Cluster 2, which showed strong
results across many indicators. In particular, it shows the highest value
for switches of play completed Average. This means that it
induced cracks in the opponent's defense based on generally strong
performance. It had high values in passing and penetration-related
indicators, but mainly used wide spaces rather than central areas.
However, crosses completed Average was low, and its scoring
ability was also weak.
4. Conclusion
This study shows that using wide spaces is important. Excluding the traditional football powerhouses, most countries emphasized the use of the wings, and this led to good results. In particular, the combination of forward penetration movements and wide-space usage appears to be a major reason for strong performance. Based on basic defensive ability, it is important not to focus only on possession, but to decide how to use the side areas of the pitch effectively.
In addition, teams can achieve better results when players move organically by exchanging positions on the pitch. Therefore, most countries use side spaces and continuous penetration. Football powerhouses composed of players with outstanding individual ability still focus on possession and control of central areas.
Among the 37 features used in the data, 33 are attacking indicators and 4 are defensive indicators. Defensive indicators were insufficient compared with attacking indicators, which caused imbalance in the data. In modern football, where the importance of defense is emphasized, this had a critical effect on the analysis. Indicators that are difficult to express numerically, such as individual ability or a manager's capability, were also not included in the analysis.