Project Report
Telco Customer Churn Prediction & Monitoring
1. Project Overview
1.1. Problem Definition and Goal
This project aims to analyze customer data from a telecommunications company and identify high-risk customers who are likely to churn in advance. It is a supervised-learning binary classification problem that predicts whether a customer will churn based on historical data. By identifying customers with high churn probability, the company can run retention promotions at the right time and encourage customers to stay.
1.2. Evaluation Metrics
Considering class imbalance in the data, this project selected Recall, Precision, and F1-score as key performance indicators instead of simple Accuracy. Increasing Recall helps detect actual churners without missing them, but it also risks unnecessary marketing cost by incorrectly classifying customers who would not churn. Therefore, the optimal threshold should maximize business profit by comparing retention cost and opportunity cost from customer loss. This analysis assumes that the loss from missing an actual churner is larger, so the model prioritizes Recall while ultimately aiming for a high F1-score, the harmonic mean of Precision and Recall.
2. Data Overview
2.1. Data Source and Structure
This project uses the Telco Customer Churn dataset from IBM Sample Data Sets. The dataset contains information on 7,043 customers, and each customer has 21 features.
2.2. Feature Description
The features in the dataset are as follows.
| Group | Feature | Description | Data Type |
|---|---|---|---|
| Identifier | customerID | Unique customer ID, excluded during analysis | Object |
| Target | Churn | Whether the customer churned in the previous month, Yes or No | Object |
| Demographics | gender | Gender, Male or Female | Object |
| SeniorCitizen | Whether the customer is 65 or older, 1 for yes and 0 for no | Int | |
| Partner | Whether the customer has a partner | Object | |
| Dependents | Whether the customer has dependents | Object | |
| Contract | tenure | Number of months subscribed to the service | Int |
| Contract | Contract type: month-to-month, one year, or two year | Object | |
| PaperlessBilling | Whether paperless billing is used | Object | |
| PaymentMethod | Payment method such as electronic check, mailed check, bank transfer, or credit card | Object | |
| Billing | MonthlyCharges | Monthly charge amount | Float |
| TotalCharges | Total charge amount since signup | Object* | |
| Service | PhoneService | Whether phone service is subscribed | Object |
| MultipleLines | Whether multiple lines are used | Object | |
| InternetService | Internet service provider: DSL, Fiber optic, or No | Object | |
| OnlineSecurity | Whether online security is subscribed | Object | |
| OnlineBackup | Whether online backup is subscribed | Object | |
| DeviceProtection | Whether device protection is subscribed | Object | |
| TechSupport | Whether technical support is subscribed | Object | |
| StreamingTV | Whether TV streaming is used | Object | |
| StreamingMovies | Whether movie streaming is used | Object |
3. EDA
3.1. Checking Data Distributions
Categorical Features
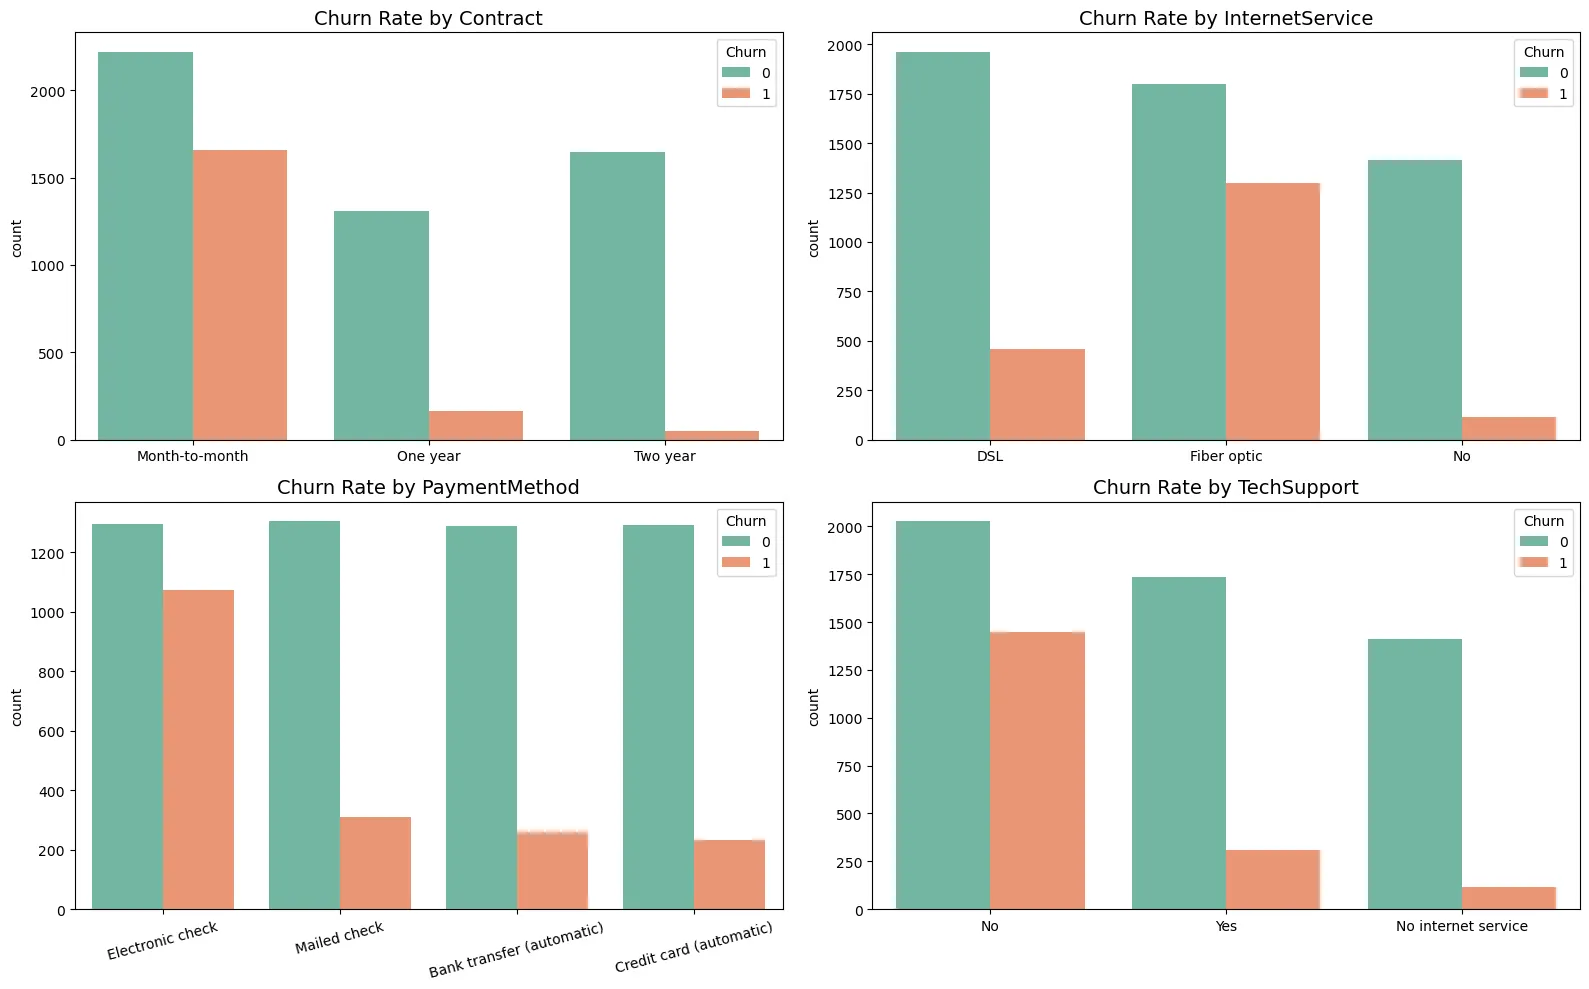
Categorical features show that customer churn is strongly influenced by contract period, service type, and payment method. The most prominent feature is Contract. Month-to-month customers have overwhelmingly high churn rates, so promotions that encourage short-term subscribers to move to long-term contracts are likely to be central to churn prevention.
In InternetService, Fiber optic users churn more than DSL users. This suggests possible dissatisfaction with price competitiveness or service quality, so a service satisfaction survey should be conducted. In PaymentMethod, Electronic check users show high churn, likely due to inconvenience in payment or characteristics of the customer segment that prefers this method, such as high price sensitivity.
Numerical Features
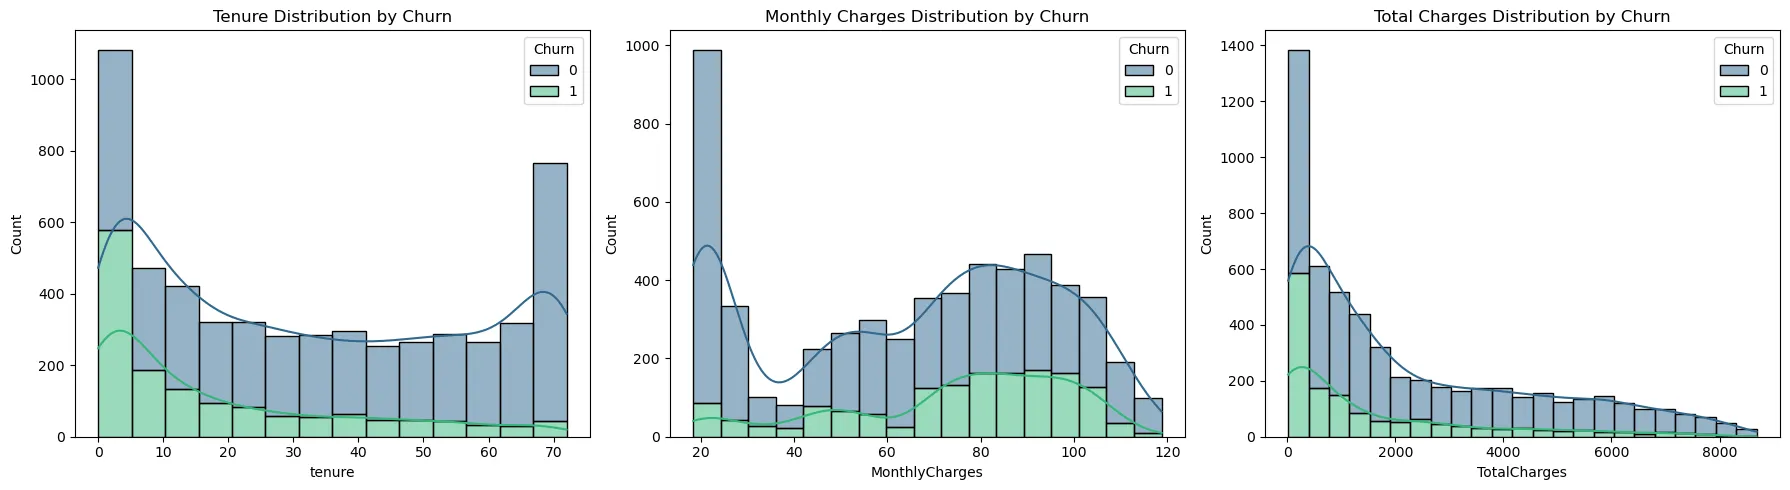
The distributions of numerical variables reveal clear patterns and preprocessing needs. Tenure shows a U-shaped distribution with high frequency at both ends, meaning there are many new and long-term customers. The high churn rate in the first one to two months suggests possible problems in the early service experience, so onboarding programs for new customers and retention strategies for long-term customers should be performed together.
MonthlyCharges has a multimodal distribution concentrated around $20 and $70 to $100. This indicates segmentation into customers using only basic services and customers using multiple services. TotalCharges is left-skewed with a long right tail, which can destabilize variance and harm model training. Therefore, log transformation should be applied to approximate a normal distribution.
3.2. Correlation and Insights
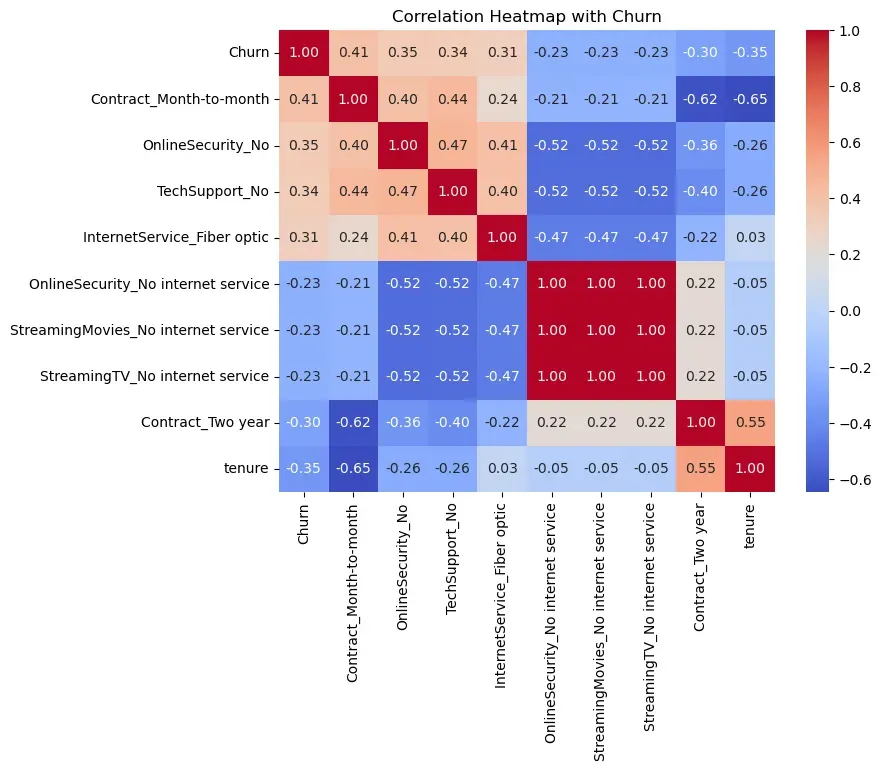
Positive Correlations That Promote Churn
Variables positively correlated with Churn show that contract type,
additional services, and internet product type are major drivers. The
strongest churn factor is month-to-month contract
(Contract_Month-to-month, 0.41). Customers with short
contract periods can cancel easily, so incentives for long-term contracts
are needed.
Not using additional services, such as OnlineSecurity_No
(0.35) and TechSupport_No (0.34), is also closely related to
churn because customers without these services have lower dependence on
the service ecosystem. Fiber optic users also show high churn (0.31),
suggesting possible pricing dissatisfaction or quality issues.
Negative Correlations That Suppress Churn
A strong negative correlation with Churn means customers with that characteristic are less likely to churn. Tenure (-0.35) is an important suppressing feature, showing that churn decreases as the subscription period increases. Two-year contracts (-0.30) also suppress churn, confirming that converting short-term customers to long-term contracts is an effective prevention strategy.
Multicollinearity
The heatmap reveals multicollinearity between variables. Items such as "No internet service" inside OnlineSecurity, StreamingTV, and TechSupport have a correlation coefficient of 1.00 with each other, meaning they contain essentially the same information. This can increase unnecessary computation and cause overfitting, so feature selection or category consolidation is needed during preprocessing.
4. Data Preprocessing
4.1. Preprocessing Strategy and Key Techniques
Solving Multicollinearity and Reducing Dimensionality
The value "No internet service" in additional-service variables such as
OnlineSecurity and TechSupport has a perfect correlation with the value
"No" in InternetService. This increases unnecessary computation and
creates multicollinearity. Therefore, those values are unified as "No" to
remove duplicate information, reduce one-hot encoded feature count, and
lower overfitting. A custom transformer,
ServiceValueSimplifier, was implemented for this purpose.
Distribution Correction for Numerical Features
TotalCharges has positive skew with a long right tail. Such skewed data can reduce the performance of linear or distance-based algorithms, so log transformation is applied. StandardScaler then aligns all numerical variables to mean 0 and variance 1.
Categorical Feature Encoding
One-Hot Encoding is performed for all categorical features so the model can interpret them.
4.2. Pipeline Construction
A Scikit-Learn Pipeline was built to automate the preprocessing strategy and apply the same transformation to training and test datasets.
Custom Transformer
A class is defined to solve multicollinearity.
class ServiceValueSimplifier(BaseEstimator, TransformerMixin):
    """
    Custom Transformer to simplify redundant categorical values.
    Example: Merges 'No internet service' into 'No' for cleaner categories.
    """
Preprocessing Pipeline
Pipelines for numerical, categorical, and log-transformed data are combined with ColumnTransformer, and ServiceValueSimplifier is placed at the front to complete the final preprocessing pipeline.
# Categorical Pipeline: Impute missing values -> One-Hot Encode
cat_pipeline = make_pipeline(
    SimpleImputer(strategy='most_frequent'),
    OneHotEncoder(handle_unknown='ignore', drop='if_binary')
)

full_pipeline = Pipeline([
    ("simplifier", ServiceValueSimplifier()),
    ("preprocessing", preprocessor)
])
5. Modeling and Optimization
5.1. Model Selection
This project selected XGBoost as the classifier. XGBoost improves the
Gradient Boosting algorithm through parallel processing and optimization
techniques and performs well on tabular classification problems compared
with models such as Random Forest and SVM. Since churn customers account
for only about 27% of the data, the scale_pos_weight
parameter can adjust loss-function weighting and strengthen learning on
the minority churn class. L1 and L2 regularization are included in the
objective function, reducing overfitting while learning complex patterns.
# Initialize the XGBoost Classifier
xgb_clf = XGBClassifier(
    use_label_encoder=False,
    eval_metric='aucpr',
    random_state=42,
    n_jobs=-1
)
The final pipeline containing preprocessing and the model is as follows.
full_pipeline = Pipeline([
    ("simplifier", ServiceValueSimplifier()),
    ("preprocessing", preprocessor),
    ("XGBClassifier", xgb_clf)
])
5.2. Hyperparameter Tuning
GridSearchCV was used to optimize model performance. F1-score, the harmonic mean of Recall and Precision, was selected as the optimization metric instead of simple accuracy. To prevent data bias and improve reliability, 10-Fold Cross Validation was applied.
- scale_pos_weight: searches from 1 to 3 to find the best balance between Precision and Recall under imbalanced data.
- n_estimators, learning_rate: control model complexity and learning speed.
- max_depth: controls tree depth to prevent overfitting.
# Define Hyperparameter Search Grid
param_grid = [{
    'XGBClassifier__n_estimators': [100, 300, 500, 700, 900],
    'XGBClassifier__max_depth': [3, 5, 7, 9],
    'XGBClassifier__learning_rate': [0.01, 0.05, 0.1],
    'XGBClassifier__scale_pos_weight': [1, 2, 3]
}]
5.3 Tuning Results and Best Parameters
After conducting 10-Fold cross validation over 540 parameter combinations for a total of 5,400 training runs, the parameter combination with the best generalization performance was selected.
Best Parameters and Performance
Best F1-Score (CV Mean): 0.6434
| scale_pos_weight | 2 | Weights churn customers twice as much as normal customers, validating the need to secure Recall under class imbalance. |
| max_depth | 3 | Uses shallow trees to suppress overfitting and focus on generalized patterns. |
| learning_rate | 0.01 | Uses a low learning rate for stable gradual learning. |
| n_estimators | 500 | Uses enough trees to compensate for the low learning rate. |
| subsample | 0.6 | Randomly samples 60% of the data during training to improve diversity and prevent overfitting. |
Result Analysis
The selected parameters, such as max_depth 3 and learning_rate 0.01, show that the model prefers conservative and stable predictions rather than complex sensitive boundaries. The scale_pos_weight value of 2 indicates that not missing actual churners, or Recall, contributed more to performance improvement than simple accuracy.
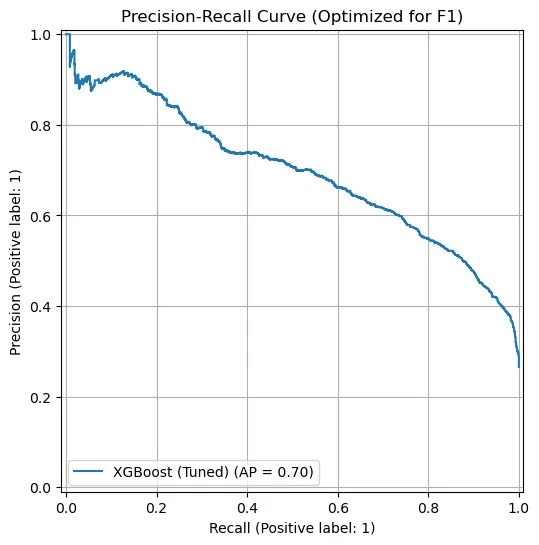
6. Results and Analysis
6.1. Final Performance Evaluation
Test Dataset Evaluation
              precision    recall  f1-score   support

          No       0.89      0.78      0.83      1035
         Yes       0.55      0.75      0.63       374

    accuracy                           0.77      1409
For the churn class (Yes), Precision was 0.55, Recall was 0.75, and F1-score was 0.63. This shows that the Recall-centered strategy defined at the beginning worked successfully. In churn prediction, the false negative cost of missing customers who actually churn is much more severe than the false positive cost of spending marketing budget on customers who would not churn. Although lower Precision can cause unnecessary cost, detecting 75% of actual churners in advance is a meaningful result.
Detailed Analysis
The confusion matrix allows a more detailed analysis of the model's prediction pattern.
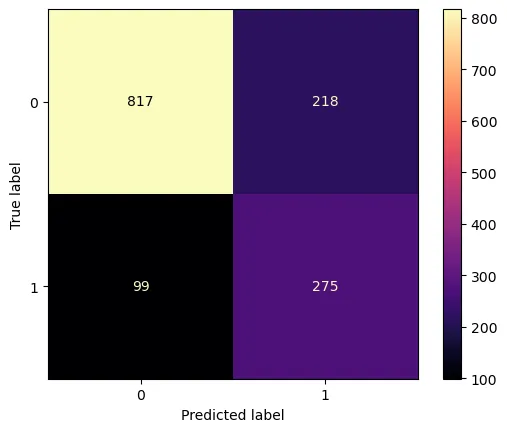
- Missed churners (False Negative: 99): 99 customers actually churned but were incorrectly predicted as non-churn. They represent about 26% of actual churners and should be reduced in future model maintenance.
- Secured defense opportunities (True Positive: 275): 275 actual churners were correctly predicted as churners, giving the company an opportunity to offer proactive promotions.
- Over-detection (False Positive: 218): these customers did not churn but were predicted to churn. Although they may create unnecessary marketing cost, retention marketing such as discount coupons or check-in messages can also improve customer satisfaction, so this can be interpreted as proactive defense cost rather than pure failure.
6.2. Feature Importance
The following analysis shows which features most strongly affected churn prediction.
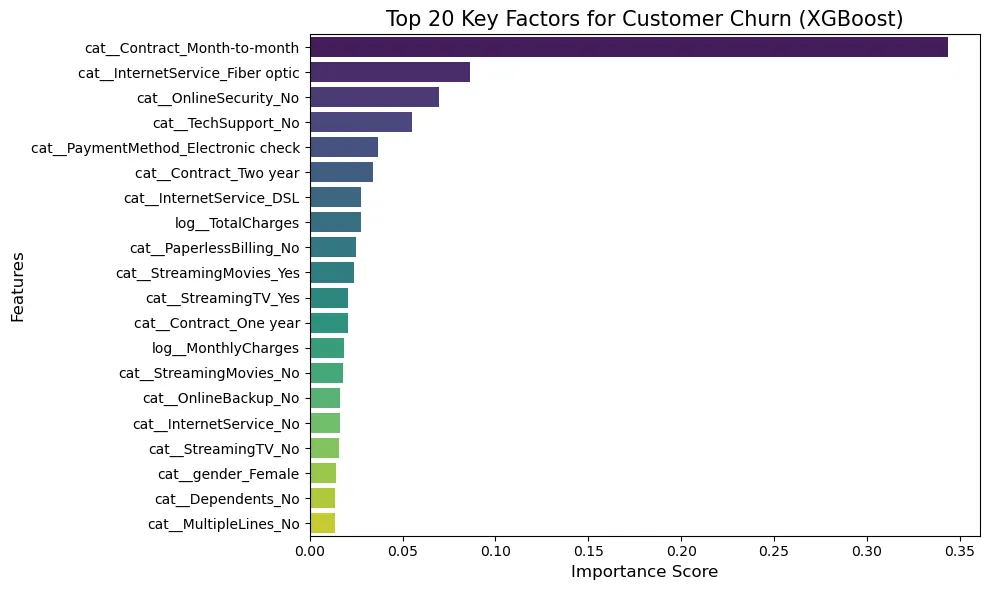
- cat__Contract_Month-to-month: the influence of contract type observed in EDA was also verified as the dominant feature in model learning. It had more than twice the importance score of the second feature, showing that contract period is the top priority in churn prevention.
- cat__InternetService_Fiber optic: Fiber optic strongly affects the model's churn prediction, meaning the algorithm captured price resistance or quality issues within this customer group.
- cat__OnlineSecurity_No, cat__TechSupport_No: while individual service subscription is important, the model classifies customers without bundled services as risky. This supports the hypothesis that bundled products mathematically lower churn probability.
7. Conclusion
7.1. Business Impact and Limitations
This project successfully built an XGBoost model based on customer data to predict churn in advance and identify major churn factors. The business impact and limitations are as follows.
Minimizing Revenue Loss Through Proactive Churn Defense
The model detected about 75% of churn customers in advance. This means the company can move beyond after-the-fact response and intervene before customers leave. If promotions are offered to the 275 high-risk customers identified in the test set, a significant number of customers may be retained and customer lifetime value can be preserved.
Improving Marketing Efficiency and Targeting Precision
By focusing resources only on customers with high churn probability rather than conducting random marketing, marketing ROI can be maximized. Month-to-month contract customers and customers without bundled products were identified as key targets. Customized promotions such as long-term contract discounts or bundle offers can improve marketing success rates.
Evidence for Improving Service Product Strategy
The high churn rate among Fiber optic users shows that service quality checks or pricing-plan reform may be urgent. Solving the issue identified by the data can strengthen overall service competitiveness.
7.2. Limitations and Future Work
These are constraints to consider when interpreting model performance and directions for improvement.
Precision Limitation and Cost Issue
Because the strategy prioritizes churn Recall, Precision is relatively low at 0.55. Marketing cost may be spent on customers predicted to churn who actually remain. To address this, low-cost marketing methods or differentiated benefits by churn probability threshold are needed.
Lack of Qualitative Data
The current model is based on quantitative data such as contract and billing information. Direct customer voices such as complaints, consultation history, and call-quality logs are not reflected. If consultation text is added through text mining or NLP, the model could identify not only churn signals but also more specific causes.
7.3. Model Operation and Maintenance Strategy
This is a pipeline plan for sustainable model operation beyond one-time analysis.
[ START: MLOps Pipeline ]
        |
        v
[ 1. Data Loading ]
(Load CSV & Simulate Drift)
        |
        v
[ 2. Drift Monitoring ]
(Evidently AI Report)
        |
        v
[ 3. Retraining Trigger ]
(If drift exceeds threshold)
        |
        v
[ 4. Model Retraining ]
(Preprocessing + GridSearchCV)
        |
        v
[ 5. Quality Gate ]
(Recall >= 0.7 and F1 >= 0.6)
        |
        v
[ 6. Model Save / Deploy ]
Monitoring System for Data Drift
To prevent model degradation and maintain performance, a data drift
detection module using Evidently AI was implemented. The
check_data_drift function statistically tests the
distribution difference between the reference data used in training and
newly incoming current data.
The system works in two stages. First, DataDriftPreset
analyzes overall dataset drift and generates a visual HTML report in the
reports/ directory with a timestamp. Second, the internal
metrics of the report are parsed programmatically for automated decision
making. If a feature's drift score exceeds a predefined threshold, the
function returns True and triggers the retraining pipeline automatically.
def check_data_drift(ref_data, curr_data):
    """
    Detects data drift between the reference and current datasets using Evidently AI.
    It generates an HTML report and returns whether significant drift was found.
    """
Retraining Pipeline Construction
When drift is detected, the system performs retraining through data merging, preprocessing, and model tuning. Reference data and new current data are first merged. Numerical missing-value handling, scaling, and categorical one-hot encoding are then applied consistently. XGBoost is used for modeling, and GridSearchCV searches for optimal hyperparameters.
The key feature of the system is that the retrained model is not deployed automatically without validation. It is approved as a new model only when it satisfies both Recall of at least 0.7 and F1-score of at least 0.6 on the test dataset. Models that pass are saved and deployed; models that do not pass are discarded.